This web page was produced as an assignment for Genetics 677, an undergraduate course at UW-Madison.
Sequence
Full gene name: solute carrier family 2 (facilitated glucose transporter), member 4
Synonyms: SLC2A4, GLUT4, IPI00027281, GTR4_HUMAN
Number of exons: 11
NCBI Full DNA Reference Sequence: AC_000060.1
Gene length: 6313bp
NCBI mRNA Reference Sequence: NM_001042.2
Transcript length: 3159bp
Full gene name: solute carrier family 2 (facilitated glucose transporter), member 4
Synonyms: SLC2A4, GLUT4, IPI00027281, GTR4_HUMAN
Number of exons: 11
NCBI Full DNA Reference Sequence: AC_000060.1
Gene length: 6313bp
NCBI mRNA Reference Sequence: NM_001042.2
Transcript length: 3159bp
Phylogeny and Homology
BLAST
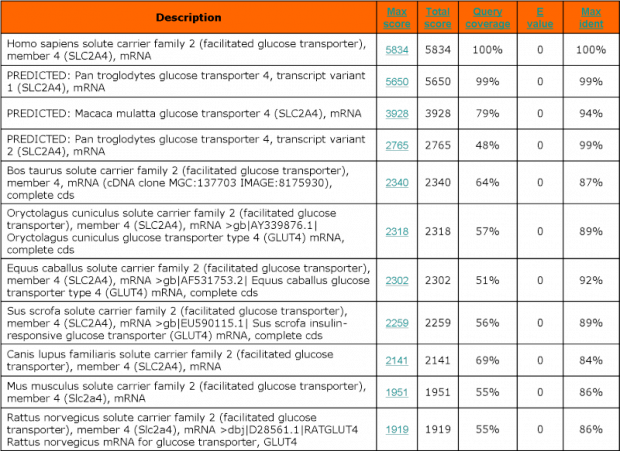
A blast alignment was performed using the Human Slc2A4 transcript sequence. The sequence was compared against other animals' genomes in order to determine homology. Several genes from different species were found to be very similar ranging from 86 to 99% identity. An E-value of "0" confirms that this match is not coincidence.
BLAST
A blast alignment was performed using the Human Slc2A4 transcript sequence. The sequence was compared against other animals' genomes in order to determine homology. Several genes from different species were found to be very similar ranging from 86 to 99% identity. An E-value of "0" confirms that this match is not coincidence.
TreeFam
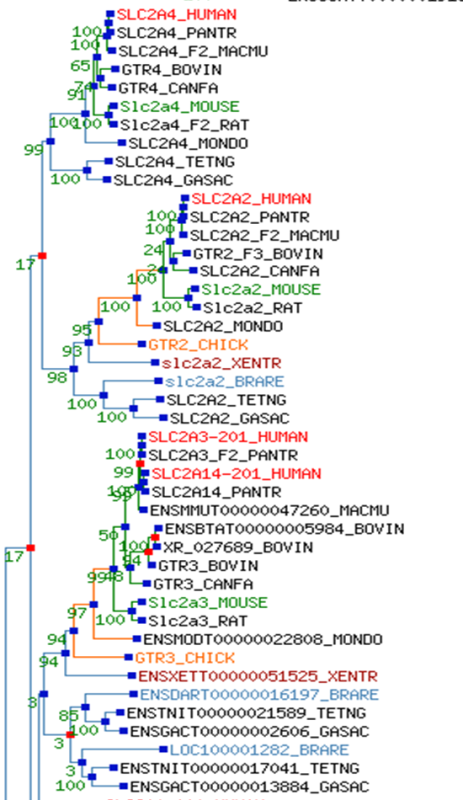
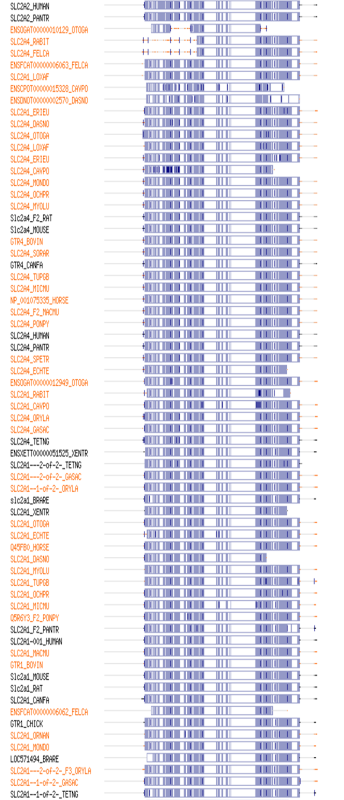
TreeFam is an online based software that assembles phylogenetic trees based on a requested gene sequence. It gives reliable infromation about paralogs and orthologs as well as the evolutionary history of gene families.
From both the phylogeny tree and the graphic alignment we can see that Slc2A4 is very well conserved among mammal species.
Analysis
As expected the Pan troglodyte homologue is the most conserved. In the picture of the tree other human and non-human species paralogues are shown. This paralog genes display high conservation as well. As expected, the function of their protein products is similar to Glut4. For instance Slc2A2 is also a glucose transporter. The tree shown below is a truncated version of the one produced by TreeFam. The original tree was excessively long since there is a lot of paralog genes of Slc2A4. Since its function is to transport glucose, it is expected that it shares sequences with other transporters.
As expected the Pan troglodyte homologue is the most conserved. In the picture of the tree other human and non-human species paralogues are shown. This paralog genes display high conservation as well. As expected, the function of their protein products is similar to Glut4. For instance Slc2A2 is also a glucose transporter. The tree shown below is a truncated version of the one produced by TreeFam. The original tree was excessively long since there is a lot of paralog genes of Slc2A4. Since its function is to transport glucose, it is expected that it shares sequences with other transporters.
DNA Motifs
Motif Search
Using Motif Search at a cutoff of 85, 85 motifs were found. At a cutoff of 95, the following 11 motifs were found:
Motif Search
Using Motif Search at a cutoff of 85, 85 motifs were found. At a cutoff of 95, the following 11 motifs were found:
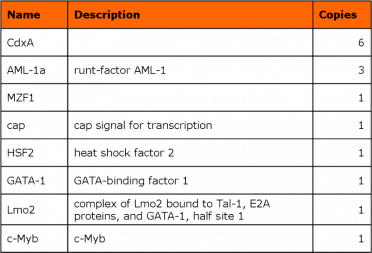
Motifs found by Motif Search
MEME
Multiple Em for Motif Elicitation (MEME) is a tool also used for motif identification. The software uses statistical modeling techniques to display the concensus sequence of a motif by using position-dependent nucleotide-probability matrices. Based on the input, your gene of interest, it automatically chooses the best fitting width. We had MEME search for three motifs (shown below).
The advange of using MEME is that the consensus sequence is displayed in a logo. However it does not provide any hint or description on what the function of the motif might be.
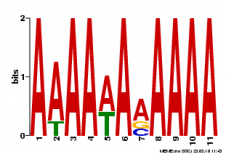
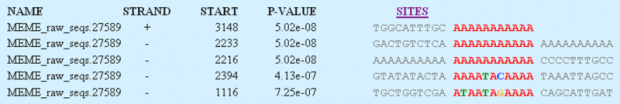
Motif 1 found by MEME
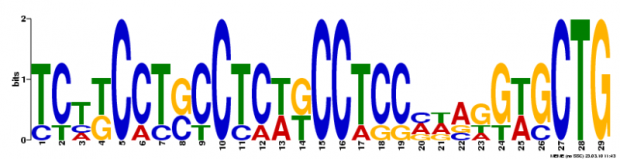
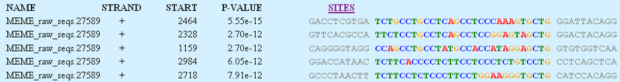
Motif 2 found by MEME
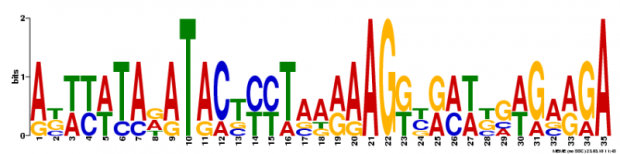

Motif 3 found by MEME
Analysis
The two softwares found similar motifs. For instance the cap motif was found was found also by MEME (2nd logo). However it is interesting to see that the motif found by Motif Search was only 8bp long whereas the MEME motif was 29bp long. This discrepancy also influences the calculations for the alignments. This generates different sites in the mRNA where the motif is found. Both MEME and Motif Search found cap 5 times, however only 2 sites match.
The two softwares found similar motifs. For instance the cap motif was found was found also by MEME (2nd logo). However it is interesting to see that the motif found by Motif Search was only 8bp long whereas the MEME motif was 29bp long. This discrepancy also influences the calculations for the alignments. This generates different sites in the mRNA where the motif is found. Both MEME and Motif Search found cap 5 times, however only 2 sites match.
Gene Expression
GEO (Gene Expression Omnibus)
GEO (Gene Expression Omnibus)
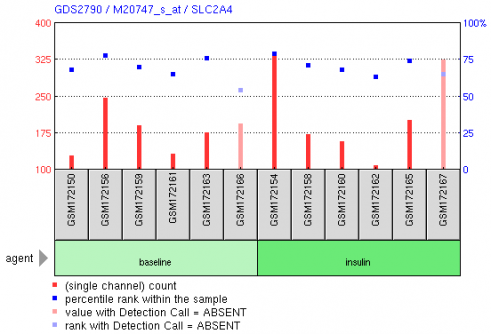
Figure 1. Analysis of skeletal muscles from non-diabetics after a 3 hour infusion of insulin. Glucose uptake by skeletal muscles in response to insulin is impaired in type 2 diabetes. Results provide insight into the molecular mechanisms regulating glucose homeostasis in response to insulin.
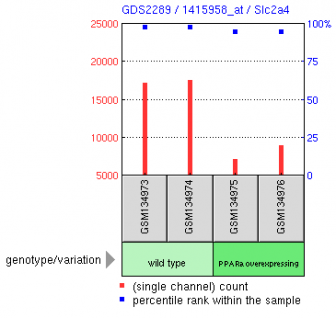
Figure 2. Analysis of skeletal muscles of transgenics (trs) overexpressing PPARalpha. Trs overexpressing PPARalpha develop glucose intolerance despite protection from diet-induced obesity. Results provide insight into the role of PPARalpha in the development of insulin-resistant diabetes
Analysis
Figure 1 shows the expression level of Glut4 in skeletal muscle cells from non-diabetic subjects both before and after insulin stimulation. We can see that they show a roughly roughly constant expression level of Glut4 even after the stimulus of insulin. This makes sense since it is known that glucose transport takes place as a result of translocation of Glut4, and not as a result of new biosynthesis of Glut4.
Figure 2 in the other hand shows a reduced level of expression in muscle from a mouse line overexpressing PPARalpha, which is a gene that presumably induces insulin-resistant diabetes. It makes sense these mice are diabetic because they have lower that normal expression levels of Glut4.
References
1. Blast http://blast.ncbi.nlm.nih.gov/Blast.cgi
2. Treefam http://www.treefam.org/
3. Motif Search http://motif.genome.jp/
4. Meme http://meme.sdsc.edu/meme4_4_0/intro.html
5. GEO http://www.ncbi.nlm.nih.gov/geo/
1. Blast http://blast.ncbi.nlm.nih.gov/Blast.cgi
2. Treefam http://www.treefam.org/
3. Motif Search http://motif.genome.jp/
4. Meme http://meme.sdsc.edu/meme4_4_0/intro.html
5. GEO http://www.ncbi.nlm.nih.gov/geo/
Carlos Gil del Alcazar, [email protected], last updated on 3/28/10
